All data tells a story. Find out what the story is and share it in a way that moves your community and/or your decision makers. Data is only useful if it is made available and disseminated in a meaningful way.
Planning
- Identify methods to share your data/story:
- What? A report, publication, infographic, poster, flyer, or video.
- How and Where? Explore the Digital Media and Social Media sections.
- Challenge all volunteers to memorize one statistic that is meaningful to them and share it with others. Organize a media campaign contest that focuses on a few key statistics.
- Sign up to present at conferences and meetings, or host lunch & learn sessions for your target audience.
Materials needed
- Art supplies
- Printer/scanner/copier
- Design templates from programs like Microsoft Publisher or websites like Piktochart.com
Resources
- Be inspired by Abigail Echo-Hawk, Director of the Urban Indian Health Institute, as she discusses research and data from the perspective of traditional storytelling in her “Indigenous Research as Storytelling” RED Talk. Her story demonstrates the need for research to understand the cultural and community needs of indigenous people.
- Find a fact sheet example from the SD Youth Risk Behavior Survey in our School Tobacco/Nicotine Survey guide School Tobacco Survey.
Follow-up
- Did sharing the data/stories result in the desired outcome or help move your goal forward?
- What feedback did volunteers get on the materials and how can they be improved?
- Was there any key data or stories missing?
Čaŋlí Coalition Example
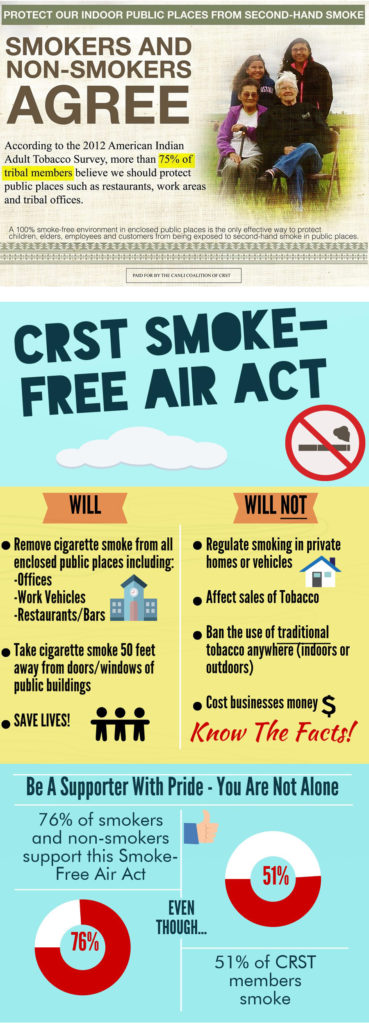
We used opinion data from a locally conducted study to create an infographic and newspaper ad that showed significant community support for smoke-free air policies in public places.

To include cultural lifeways… we used our sacred ones (children and elders) in our photos.